
Author: Ken Gray
Editors: Margaret Remilton and Diane Bull
 |
Full Story |
Being too dogmatic about cyclones is not wise. They can be stressful events and there is much hyperbole in the warnings and the accounts of their impacts. Even after the event, claims about the severity of damage and the speed of winds vary considerably. According to the Bureau of Meteorology:
Tropical cyclones affect all of northern Australia, with the northwest of Western Australia between Broome and Exmouth being the most cyclone prone part of Australia's coastline. The Australian cyclone season officially runs from November to April, although very few have occurred in November.
The Bureau of Meteorology (BoM) statistics are a valuable resource for past storm data. Categories (1-5), highest wind gust speeds, lowest pressure readings, storm diameters, and deaths caused are the parameters that are most frequently mentioned. Verifiable data is scarce, even for recent events. That is largely because there are so few Bureau of Meteorology Weather Stations in the region and the pressure recording equipment is often unable to withstand the forces of high category cyclones.
A quality anemometer should be able to read wind speeds of up to 400 kph, but looking at the reports on most Queensland cyclones they invariably fail at a little over half that speed. When BoM anemometers fail, it leads to guesswork with some researchers in Cyclone Yasi using data derived from failures of road signs, a truly unreliable way to measure maximum wind speeds.
The documentation of Queensland cyclones began in 1858 and in the Cairns to Cardwell section of the coastline, six Category 2 or greater cyclones are listed: 1882 Cat 2 crossing at Cardwell; 1890 Cat 3 Cardwell; 1918 Cat 5 Innisfail; 1986 Cat 3 Winifred, Cowley Beach; 2006 Cat 4 Larry, Innisfail; and 2011 Cat 5 Yasi, Mission Beach.
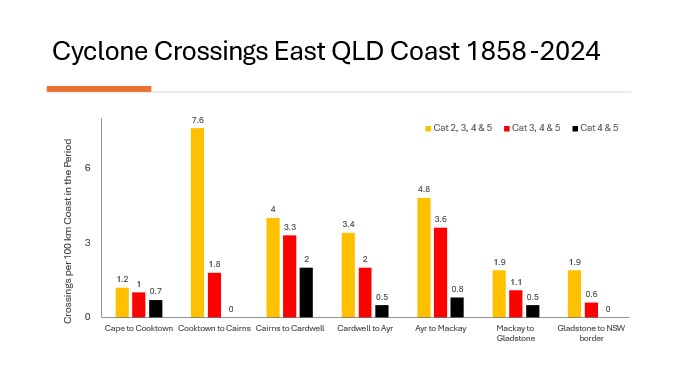
From 1858 to 2024, the stretch of the east QLD coastline that had the greatest number of Cat 2 to Cat 5 cyclone strikes per 100 kilometres of the coast was the Cairns to Cooktown sector with 7.6 Cat 2+ cyclones/100 km. While the Cairns to Cardwell sector has been hit most often in recent years, it is moderate for the entire period at 4 events per 100 km.
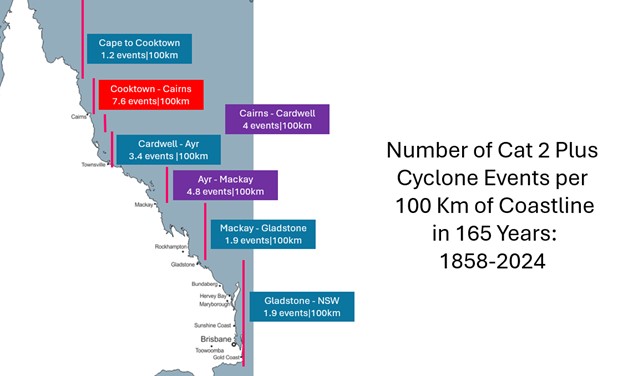
However, if we look at the peak zone frequencies of more severe cyclones, for the heavy-duty Cat 4 and Cat 5 events, the Cassowary Coast has been hit hardest since 1858. 165 years sounds a long time, yet for weather stats it is a small sample and you would need the records going back 1,000 years to know precisely what part of the coast has been hit most often. The chart below shows that the peak zone for severe storms is located between Cooktown and Mackay.
The first of the Cat 2+ cyclones to hit the Cairns to Cardwell sector after 1858 occurred before Mission Beach was settled by Europeans. It is well-known that the 1890 cyclone had devastating repercussions, destroying the Cuttens homestead in Bingil Bay and the residence of Willoughby and Alice Smith in Clump Point. In order to recover economically, the Cutten men had to seek work in the inland area for some time.
There was a cyclone in 1911 that crossed well south of Mission Beach and sunk the Yongala off Townsville, but while it damaged the Cutten breakwater and their crops, it was not a large cyclone for this district. In 1913, a small cyclone caused damage to crops at Bingil Bay.
The first major event for us was the 1918 cyclone that crossed Innisfail. That one and three recent cyclones all caused major damage in Mission Beach. We can compare these with the largest ever cyclone crossing the Queensland coast (Mahina, 1899) as well as the largest to cross the coast anywhere in Australia (Monica, Arnhem Land, 2006). I will add Cyclone Tracy of 1971 to the comparison as it is remembered by many.
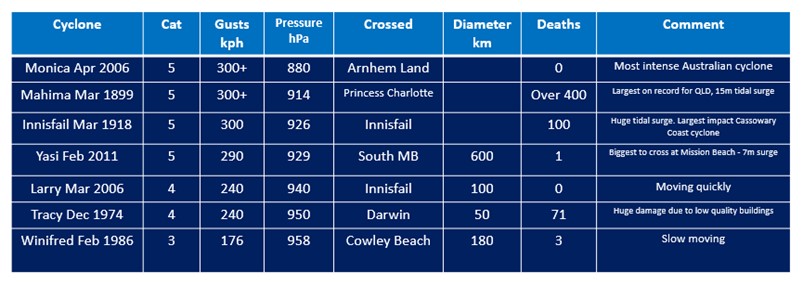
Monica crossed the QLD coast first as a Cat 3 storm then crossed into the gulf and onto West Arnhem Land. It crossed as a Category 5 storm in the district of Maningrida, with a population of 2,500, and must have been very scary.
The name Cyclone Mahina comes from a ship that sank with the same name. Around 150 ships and boats were sunk, leaving the pearling fleet devastated. The 15-meter storm surge rapidly took the waters to places unheard of. It is thought today that the pressure may have dropped to as low as 880 hPa i.e., similar to Monica.
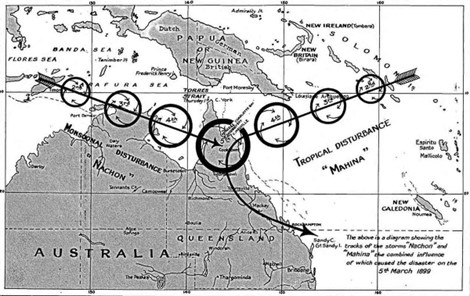 Tracking maps Mahina and Nachon 1899. The National Museum of Australia.
The Innisfail cyclone of 1918 is the largest recorded in the Cassowary Coast Region since European settlement. There were at least 83 deaths and undoubtedly many more because several Aboriginal people took to the bush. Only one out of 12 buildings survived in Innisfail, and the town had a population of 3,500 at the time, so there could have been more than 1,000 buildings.
Les Alexander of Bingil Bay met with Roz Glazebrook, a freelance writer from Brisbane, not long before he died. They chatted about the old days at Bicton. Roz published her interview notes with images that Les provided for the Innisfail District Historical Society’s 100th Anniversary of the 1918 cyclone.
An accident with dynamite caused Les to lose his left hand in early 1918. When the cyclone came, only six weeks after this accident, Les was at Innisfail, but he was immediately up and about and organizing a group to take supplies to the people in Clump Point. Les had initially been at the Strand Hotel on the Esplanade when the cyclone hit Innisfail. During the lull, when the eye was above them, he was surprised at the calmness, but the wind suddenly picked up again so he joined hundreds of others in the Shire Hall. That building was among the few that survived the second stage of the cyclone. In the morning, Les found the boat owner, Harry Worth, and asked him to take him to Clump Point to assist the survivors. One of Harry's boats, the Olive, was still afloat, and they had it ready to sail at the beginning of the next day. Les was initially refused assistance and food supplies for the people of Clump Point by the senior Council people on the Disaster Committee who were saying that the people of Clump Point numbered only 24 and Innisfail residents must have priority.
That was a comment typical of the day; placing Innisfail’s interests above all others and noting that while there were 24 European residents at Clump Point, the Council did not mention the more than 200 inmates of the Hull River Aboriginal Settlement in their calculations of people needing assistance at Clump Point.
Fortunately, Les patiently insisted and obtained some supplies to take south to Kurrimine, the Barnard Islands, and Clump Point. He and Harry, with deckhand Otto Krabbenhoft set sail early on the 12th of March 1918 and once in Clump Point, the rescue crew was joined by Jack Bunting (husband of Margaret Cutten) and Chris Wildsoet, a fellow timber-getter and soon-to-be Jack’s brother-in-law, also from the Hull River area of Clump Point.
The team found that Alf James, John, and Kathleen Kenny were killed in the cyclone, as were at least three Aboriginals from the Hull River Aboriginal Settlement. Les mentioned that the number of Aboriginal deaths due to the storm surge that flooded their camp was unknown. Although some residents were severely injured, the settlers in Bicton managed to survive. All the structures, including the wharf, boats, buildings, and orchards, were destroyed. The new wharf that was constructed by the government at Narragon Beach was also lost. The Cuttens had waited for 32 years for that infrastructure, but it was only used three times before it was swept away in a few tempestuous hours.
Edmund Banfield published an in-depth article on the 1918 cyclone in the Townsville Daily Bulletin and provided us with an understanding of the devastation at Bicton.
At Bicton, the home of Messrs. Cutten Brothers, a dismal amount of damage was done. At the time the three brothers had for company a niece [Margaret Alexander] and nephew [Ken Alexander] a son of Mr. J Bunting [Jack Bunting, soon to marry Margaret], their sister with two children being at Cairns on a visit. At a quarter to eight on the fateful Sunday evening, the house beginning to be rickety, the occupants rushed out and were scattered. Mr. Sidney Cutten, disabled by an accident some weeks before, fell and crawled he knew not whither for about half an hour, eventually bringing up against a garden fence, and there he lay throughout the long hours of the night. Kenneth Alexander and Jack Bunting took care of Miss Margaret Alexander, each holding a hand. Kenneth had secured a blanket before leaving the house with which to envelop his sister. He struggled to keep it, but it tore in two, and with the remaining fragments as a covering, the young lady passed the night with her protectors. Messrs. Herbert and Leonard Cutten found themselves on the brink of the cliff in front of the house, and towards dawn groped their way back to the ruins, there meeting their nephew and niece and Jack Bunting. A brief search revealed Sidney, enduring his privations as philosophically as circumstances permitted. At daylight all walked to the dismantled sawmill, one of the buildings that afforded some shelter.
Cyclone Winifred was only a Cat 3 storm, yet it packed a heavy punch. Larry and Yasi were both larger and more devastating. No cyclone, it seems, is like another. Winifred’s impacts were massive despite its relatively low intensity. Part of the reason for that was it was slow moving and another reason was that the forest was mature as there had been no severe cyclones in the region for 68 years. The damage created has almost as much to do with the duration of the high winds as it does the wind speed. Larry was far more intense than Winifred but was smaller and was moving faster. Yasi was the most intense of the three and had a much larger diameter.
We owned land on the beachfront in Wongaling when Winifred hit and had not built but returned not long after. The locals spoke in awe of Winifred, which made us reconsider where to build. After reading a comprehensive Bureau of Meteorology report on Winifred, I conducted research on the 1918 cyclone.
The 1918 cyclone crossed land at near to high tide and tossed huge volumes of sand onto the land at the back of the dunes at Wongaling. I was of the opinion that if a similar storm happened on an outgoing tide, the land we had might be taken out and dumped in the Coral Sea. We sold the land and purchased 17 acres of beachside forest that was well elevated and out of the way of cyclones and tsunamis. A decade after building on Brookes Beach, we lay wide awake in the darkness as Cyclone Larry created its unique brand of havoc. Our home was strongly built and largely undamaged by Larry, yet we were on high alert and vividly recalling the wild Winifred stories as we listened to Larry at work.
When we walked out nervously into the sunlight after Larry had stopped, the scene was utterly devastating. We believed that the gorgeous forest would never recover. After a few years, it was once again gleaming green. It does take 20 years to fully recover its full glorious canopy, yet it grows back quickly.
Yasi was made of much tougher stuff, but the forest only had five years to regrow after Larry, so the vegetative devastation was not as bad as it was in Larry. What we found was that parts of the forest were damaged, while parts only a few meters away were much less so. There were many localised tornado-like events within Yasi. A tiny storm that came shortly after Yasi was not declared a cyclone, however, a home in Mission Beach was flattened and we concluded that was due to such a tornado event within the storm.
Perspective
After experiencing two or three severe cyclone events, people may think they have worked cyclones out. The only thing inevitable about cyclones is that there will be another one coming. When you are new to cyclones, the first severe one you experience can be somewhat stressful. The media, local governments, and government agencies often exaggerate their frequency, danger, and impact. The reality is that Mission Beach has experienced an average of one severe cyclone (Category 2 or higher) every 29 years over the period from 1858 until 2024. If you build a strong home and prepare well, the dangers to life are far lower than for floods, tsunamis, tornadoes, earthquakes and bush fires where you are more at the mercy of nature’s wrath.
Forecasting Cyclones
Although cyclones have not changed significantly over the past 150 years, the ability to predict them has made significant progress. With global warming upon us, some expect a reduction in the number of small impact cyclones and an increase in frequency of higher-category storms. The logic suggests it is highly likely, but the data is insufficient to know for sure.
In the last 30 years, cyclone tracking has greatly improved our ability to predict the path and intensity of impending events. Error rates for the best systems have typically improved by 75% over the past 30 years. Governments have a wealth of models that are used worldwide, and the best ones are highly resourced. The offices of the organizations running the most widely accepted models (below) provide an indication of the resources involved.
 ECMWF offices in Bologna, Italy.
 National Center for Weather & Climate Prediction, (GFS model) Silver Spring, Maryland, USA.
Mission Beach residents in March 1918 had no idea whatsoever that a huge cyclone was looming. It is very different in 2024, with two weeks of media chat and grave warnings, even before a small storm arrives. You can access four of the best models available on Windy.com with just a few clicks on your computer or phone. These show all sorts of data and you simply move a cursor along to see how the storm changes over time. It provides data on location, wind speeds, rainfall, and more on an easily navigated map.
The Bureau of Meteorology uses all of these models and many more. They have an obligation to prepare us for the worst possible outcomes, so their tracking map and warnings are not a single best prediction, rather, they show a range of possible outcomes. Because of that, they tend to predict stronger winds than those that actually occur. The four models available free on Windy.com are the Euro (Europe), GFS (USA), ACCESS (BoM), and ICON (German). If you only have time to look at one, Windy.com suggests the ECMWF (Euro).
EURO: This is the European Centre for Medium Range World Forecasts (ECMWF), a global cyclone tracking model, run on behalf of 34 European nations from supercomputers based in Bologna, Italy. Windy.com, a popular cyclone tracking app, considers this to be the most accurate of the commonly available models. Relative accuracy is a hotly debated topic among academics, but the Euro and GFS are probably the most universally accepted and respected models. The Euro service is paid for by users, while other models, such as GFS, are free. Windy.com offers both services for free and recommends using both.
The launch of this model occurred in 1985. The model is non-hydrostatic. That means they use altitude data instead of atmospheric pressure data, as used in hydrostatic models such as GFS. At 12 hours lead-time, the Euro is 95-96% accurate, and at 10 days lead-time, it is 65-80% accurate.
GFS: The Global Forecast model is the equivalent of the Euro for the American government. It is run by the National Oceanic and Atmospheric Administration from their Weather and Climate Prediction Center in Silver Springs, Maryland, USA. The model started in 1980 and uses atmospheric pressure instead of altitude data. Predicting the impacts of terrain becomes more difficult due to that. It upgrades four times daily compared to twice daily for the Euro but has lower resolution levels. Euro and GFS are both models that stand out. GFS has been upgraded 16 times since inception and, like the Euro, is continuously tested for accuracy. The last GFS revamp was in 2019.
ACCESS: In 2018, the BoM replaced its forecasting model with one it created with the CSIRO. The name of it is ACCESS or the Australian Community Climate and Earth System Simulator. This is based on the UK Met system model and does not have the high resolution of the Euro, but it is quite accurate.
ICON: This is the Icosahedral Nonhydrostatic model run by the German Met from Offenbach in Germany. This model is slightly more accurate than the Euro for European forecasts because of its enhanced resolution. The differences are not great though and the Euro is usually better in the Pacific. The disadvantage of this model is that it only provides forecasts for five days, whereas most other models only provide forecasts for 10 days.
The US Navy also has a cyclone forecasting model available online, named the JWTC, Joint Typhoon Warning Centre, run from Pearl Harbour in Hawaii, but that, like ICON, has only a 5 day window. The model was introduced in 1959. It is not as easy to use as Windy.com is to use and does not provide nearly the same range of data.
False Impressions
It is easy to be misled and think that cyclones are common events in northern Queensland. This myth is regularly reinforced by the media through their obsession with disasters. The truth is that severe tropical cyclone coastal crossings are uncommon occurrences.
The Bureau of Meteorology observes and reports on an average of 10 cyclones across northern Australia every year. Each season, an average of three are monitored for Queensland's east coast. The vast majority of these are not intense at landfall, or do not cross the coast. For every 20 storms tracked by BoM, only one crosses the coast as a Cat 2+. For our region, Cat 2+ crossings are a 1 in 29 year event.
At the time of writing this article, a small cyclone hit northern Queensland. Just 7 hours before Kirrily was expected to cross the coast, the major forecasting models were all predicting maximum wind gusts of 105 to 125 kph i.e., all were saying it would be Cat 1. A late warning was issued by the BoM anticipating a Cat 3 storm with wind gusts of up to 170 kph.
On 25 January 2024 at 4pm, the models on Windy.com were telling us:
|
FORECAST MODEL |
CROSSING AT |
WHEN? |
PEAK GUSTS |
CATEGORY |
|
ECMWF (Euro) |
TVL-Ayr |
25/01 2000 hrs |
105 |
Low Cat 1 |
|
GFS (USA) |
TVL |
25/01 2000 hrs |
105 |
Low Cat 1 |
|
ACCESS (BoM Model) |
TVL-Ingham |
25/01 2000 hrs |
125 |
High Cat 1 |
|
ICON (Germany) |
TVL-Ingham |
25/01 2400 hrs |
105 |
Low Cat 1 |
|
JTWC (US Navy) |
TVL |
25/01 2400 hrs |
120 |
Cat 1 |
|
BoM (Track Warnings) |
TVL just north |
25/01 2300 hrs |
170 |
Cat 3 |
The media responded to this news with the typical scary headlines.
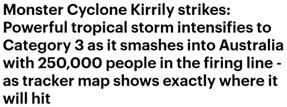 Daily Mail 25 January 2024.
It was another false alarm, however. Soon after, the ABC admitted, Tropical Cyclone Kirrily has been downgraded to a category one system as it crosses the Queensland coast, the Bureau of Meteorology says.
It may well have been a low Cat 2 cyclone as it neared landfall, but there was no doubt after the event that the forecasting models had been accurate in their predictions. The Townsville Bulletin published news soon after the event, and Emergency Services personnel posted comments indicating that the storm was minor.
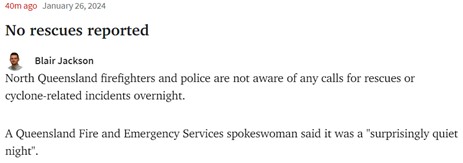
Townsville Bulletin post by emergency services after Cyclone Kirrily. https://www.townsvillebulletin.com.au/news/townsville/cyclone-kirrily-townsville-bom-latest-track-map-forecast-updates/live-coverage/694b9e8651a57e5282493948ab596622
Cyclone Chasers, a Townsville-based group that videos storm events and has a wide following, was deeply disappointed by the low intensity of Kirrily. They showed people roaming out and about during the storm, and there was a kite-surfer enjoying the waves and breeze in Townsville. There were a few trees down and power was cut to many homes, but most of the power was restored in four days.
The BoM probably saw an outlier forecast and did the right thing by reporting the possibility of a bigger than expected storm. It's necessary for them to be cautious. The danger of crying wolf though is that people may stop believing the warnings. Is there a tendency for BoM warnings to overstate the danger? Not sure. Time will tell and more history will be created, but we are lucky to have such fabulous cyclone forecasting information available in an instant to moderate the media hype and provide quality predictions.
The world of storm forecasting is rapidly changing, and while BoM warnings are useful, they are only one of many sources of information available to help us prepare wisely.
Further Reading
Ken Campbell, Superintendent Kenny: The Hull River Aboriginal Settlement, Mission Beach Historical Society, H025, 2022, online at: https://www.mbhs.com.au/images/H025-Superintendent-Kenny/H025.pdf
Defining Moments. Cyclone Mahina, National Museum Australia,
online at: https://www.nma.gov.au/defining-moments/resources/cyclone-mahina
Roz Glazebrook, 100-Year History of Innisfail Cyclone, March 2018, online at: https://www.weekendnotes.com/100-year-anniversary-of-innisfail-cyclone-innisfail-historical-society/
Published by Mission Beach Historical Society Inc.
Document S013 Version 1. Website: mbhs.com.au
This publication is copyright © Mission Beach Historical Society, 2024. First published by MBHS Inc.
Author: Ken Gray. Editors: Margaret Remilton and Diane Bull.
Apart from fair dealing for private study, research, criticism, or review, as permitted by the Copyright Act, no part of this work may be stored, reproduced, or transmitted in any form or by any means without written permission. Inquiries should be addressed to the publisher. A record of this title is held at the National Library of Australia (eBook) and the State Library of Queensland (Print and eBook). The text and opinions expressed in this book are those of the author and of the people interviewed by the author and do not reflect the views of the Mission Beach Historical Society or its members.
Mission Beach Historical Society’s logo is designed by Leonard Andy, copyright © Leonard Andy. The design depicts a Djiru shield with a cassowary which is the endangered, iconic flightless bird living in the north Queensland rainforests. The histories published by the Mission Beach Historical Society are as accurate as we can make them. Few accounts of history are 100% correct, and there are going to be more errors when we recall the events of many years ago. We always welcome suggested edits and additions or deletions, and where possible we will edit where we find we are in error.
Cover Image
Top: Bureau of Meteorology Tracking Map – heading arrow straight for Yasi, landing at Dunk Island.
Bottom: Cyclone Larry – havoc for tourism infrastructure, the old ticket office at the jetty is destroyed.
 Best cyclone Cat? Cat 0 calmly passes by.
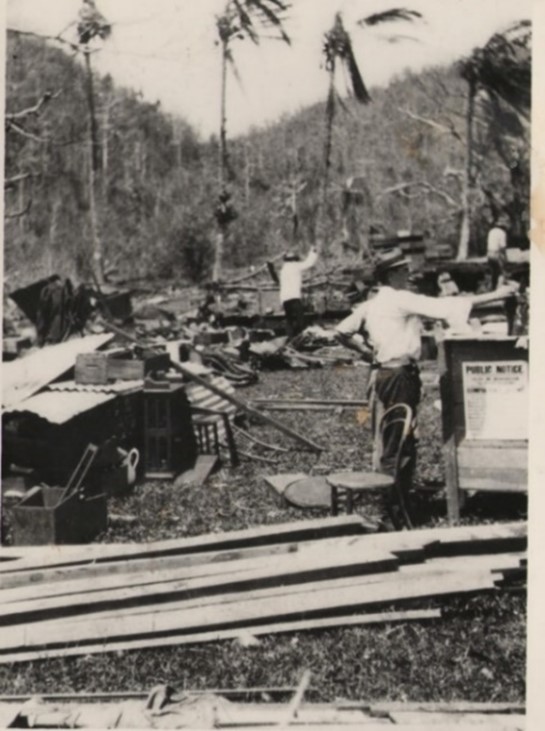 cyclone bravery: Les Alexander comes to the rescue for Mission Beach after the 1918 cyclone - he lost his left hand 6 weeks earlier. Days after the cyclone, Les is running the polling booth at Bingil Bay. From Roz Glazebrook, see Further Reading.
|
Full Story |
